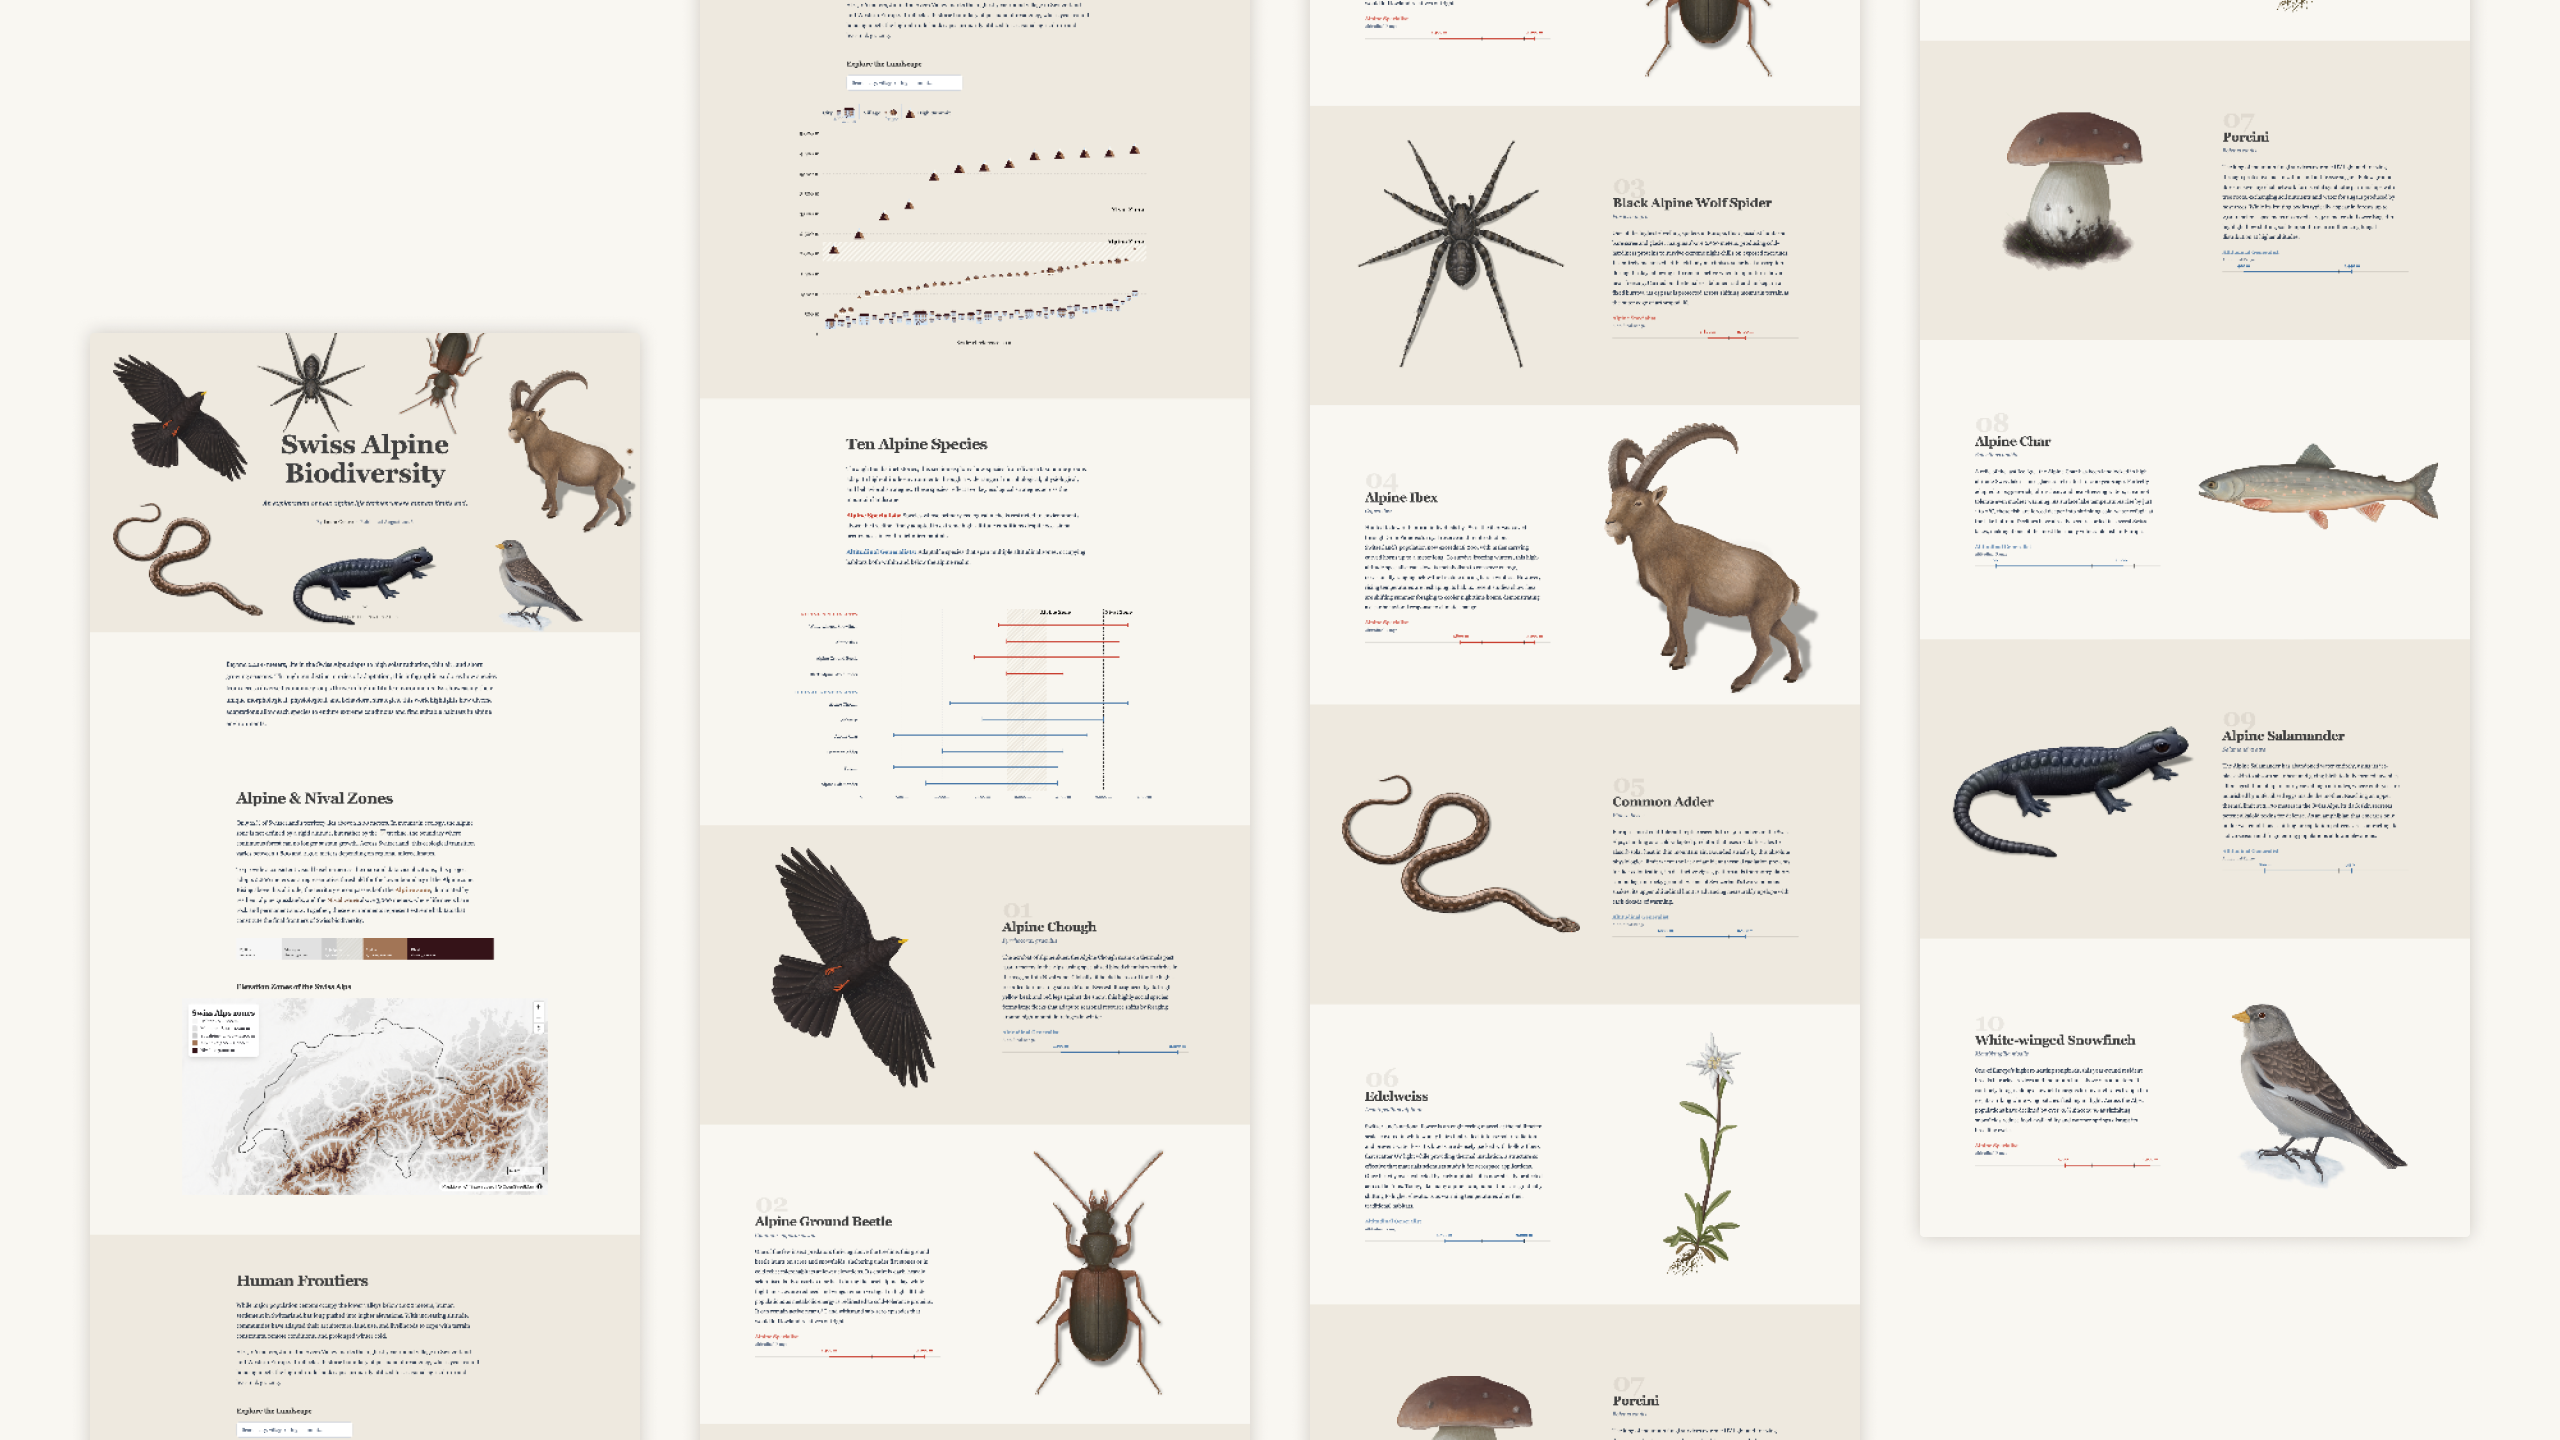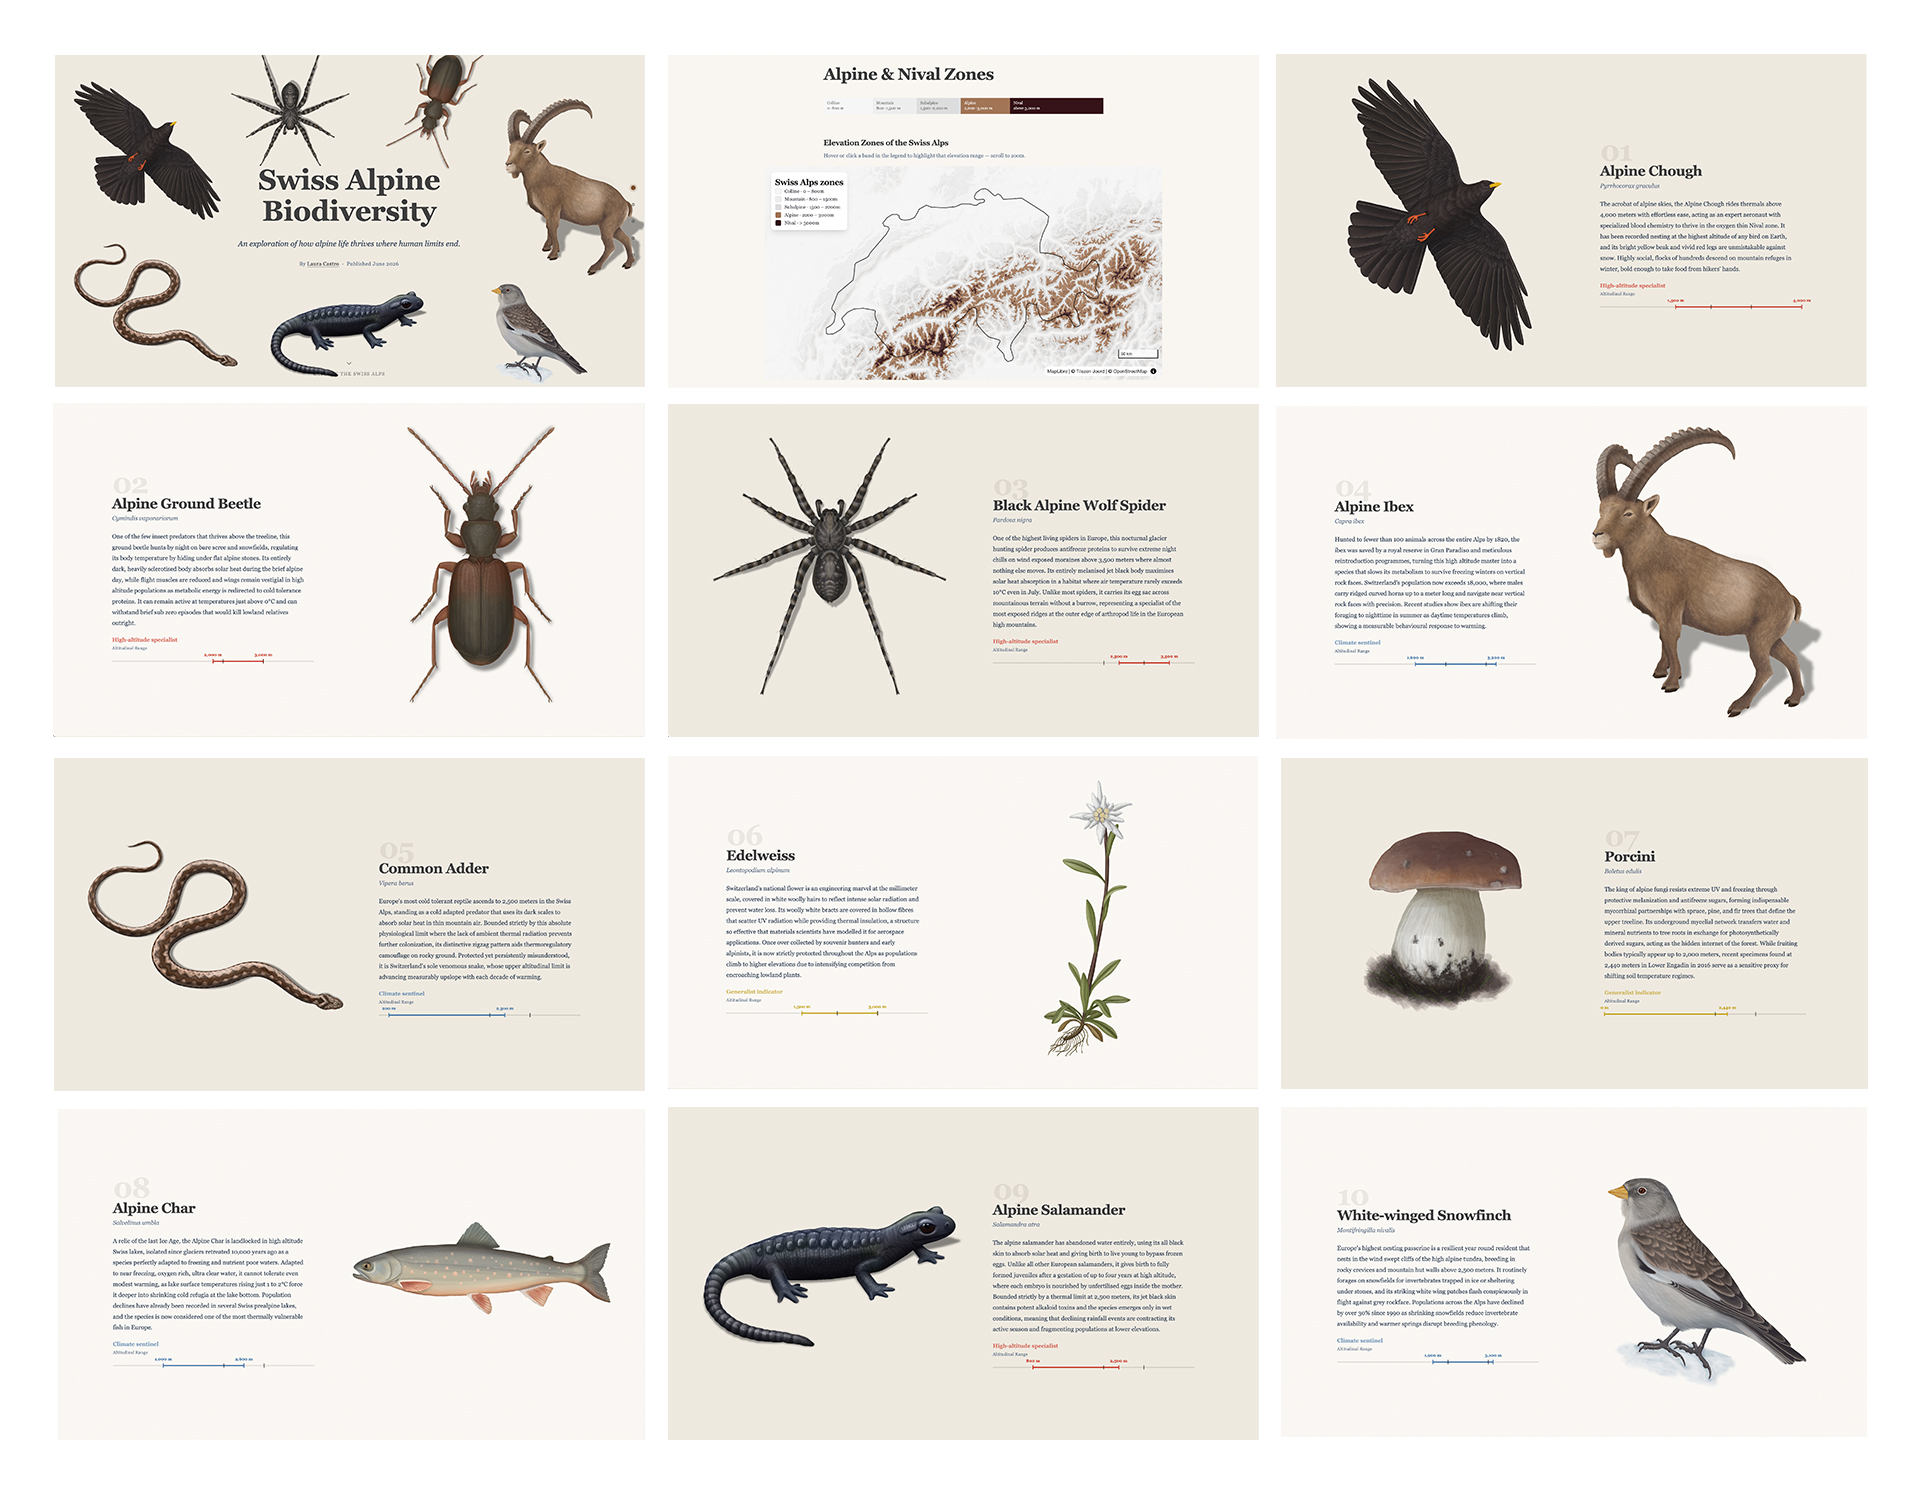
Concept
Driven by a personal fascination with mountain ecosystems, this project explores how alpine life adapts to extreme environments above the 2,200 meter treeline. It marks my first venture into a hand-drawn digital illustration technique, which I applied strictly following the conventions of traditional scientific illustration to depict each species with anatomical accuracy. Combining species observational datasets with this visual framework, I directed the project to translate high-altitude biodiversity data into an interactive visual narrative.
Objective
The objective of this digital experience is to create an educational infographic for nature enthusiasts, curious minds, and the general public interested in alpine biodiversity. By mapping the biological strategies and altitudinal distributions of ten species in the Swiss Alps, and categorizing them into Alpine Specialists and Altitudinal Generalists, the project visualizes how elevation shapes species occurrence, translating observational datasets into an intuitive and engaging educational resource.
My Role
As the designer and developer behind this independent project, I managed every phase from inception to deployment:
- Research & Data Curation: Selecting key indicator species and cross-referencing species occurrence data using official Swiss databases to build a solid scientific foundation.
- Art Direction & Scientific Illustration: Learning and applying a challenging, 100% hand-drawn digital illustration style to catalog each species with precision.
- Product Design & Layout: Designing the information architecture and structure of the infographic, ensuring a compelling storytelling flow, intuitive navigation, and clear content hierarchy.
- Frontend Development: Building the interactive digital platform, using Claude Code as a development assistant to accelerate implementation based on my design decisions.
Process
Scientific Grounding: I researched Swiss alpine datasets to select species that represent high-altitude ecosystem dynamics. I established an educational framework based on two primary ecological strategies: Alpine Specialists (species strictly tied to high-altitude environments above the treeline) and Altitudinal Generalists (adaptable species spanning multiple altitudinal zones).
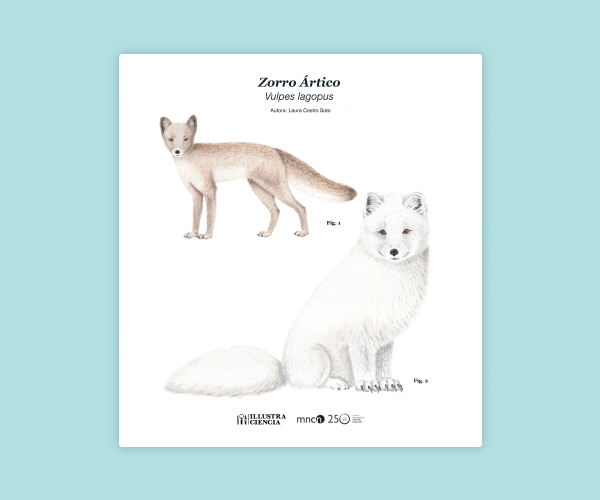
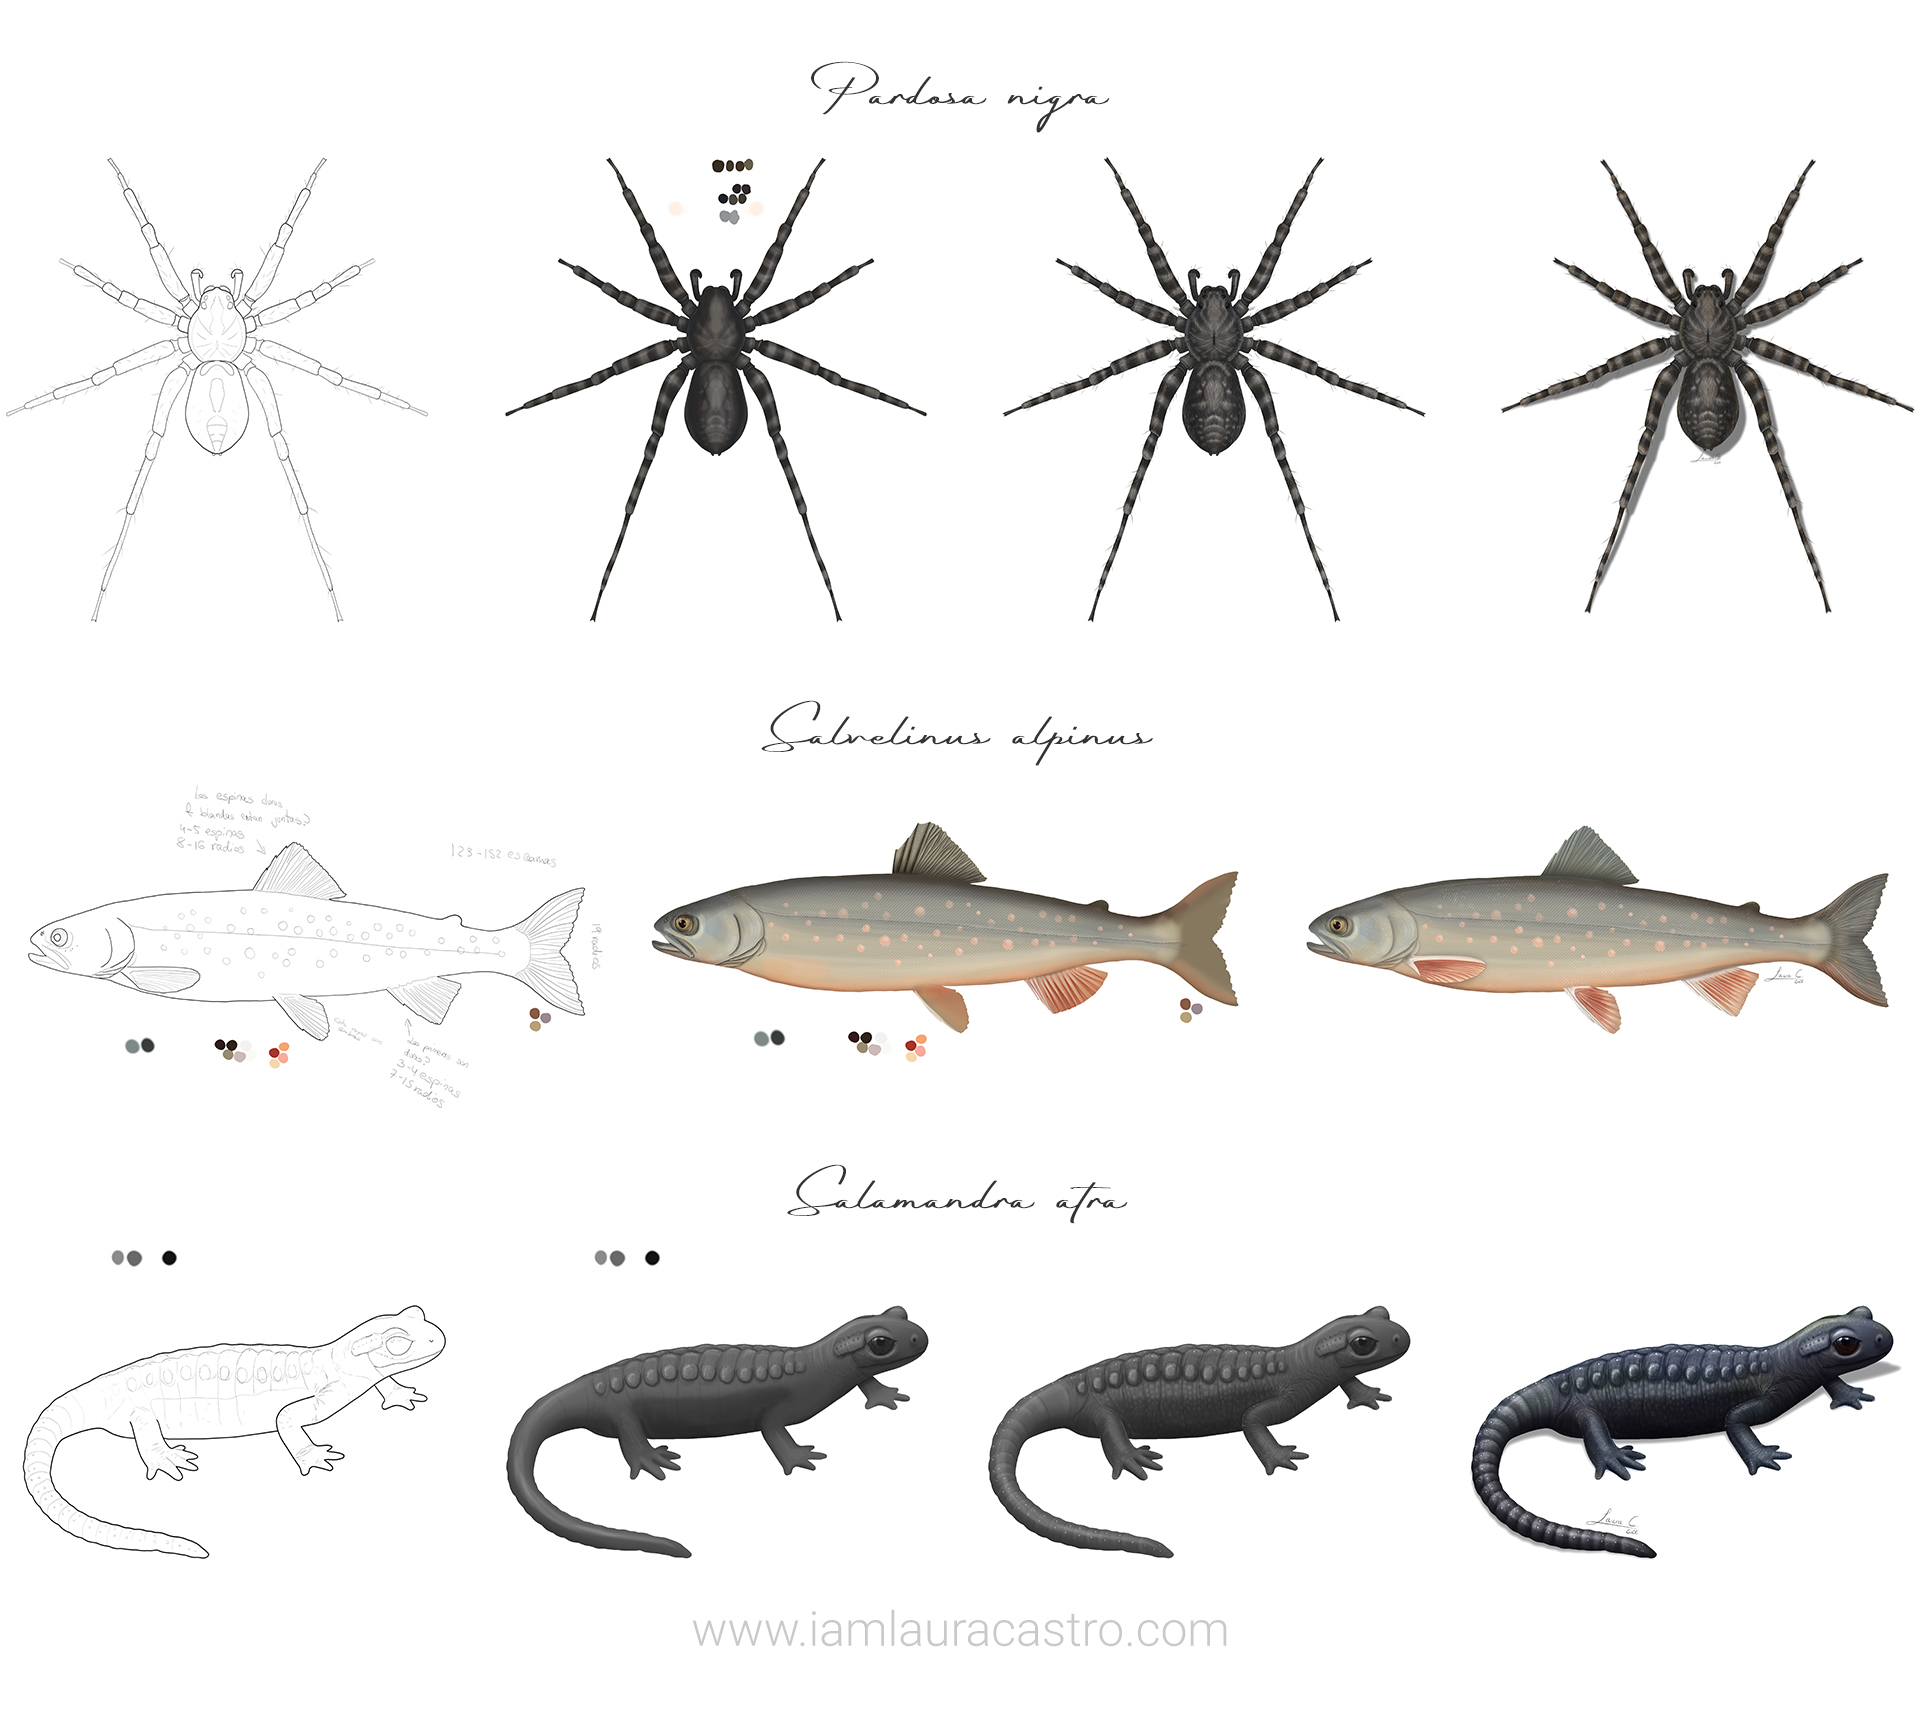
Scientific Illustration: Every visual asset was drawn by hand in Photoshop using digital brushes, adhering strictly to the conventions of traditional scientific illustration. Rather than portraying individual specimens, each subject represents an ideal archetype depicted in the posture that best reveals its diagnostic features for identification, such as dorsal views for insects to highlight symmetry, lateral profiles for mammals and birds, or top-down perspectives to clearly display snake scale patterns.
Product Architecture and Data Visualization: I initially developed a static printed version of the infographic, using QGIS for geographic mapping and RAWGraphs for data visualization to establish the layout and content hierarchy. For the final web experience, I transitioned these visualizations into code using MapLibre for dynamic mapping and D3.js for custom interactive charts.
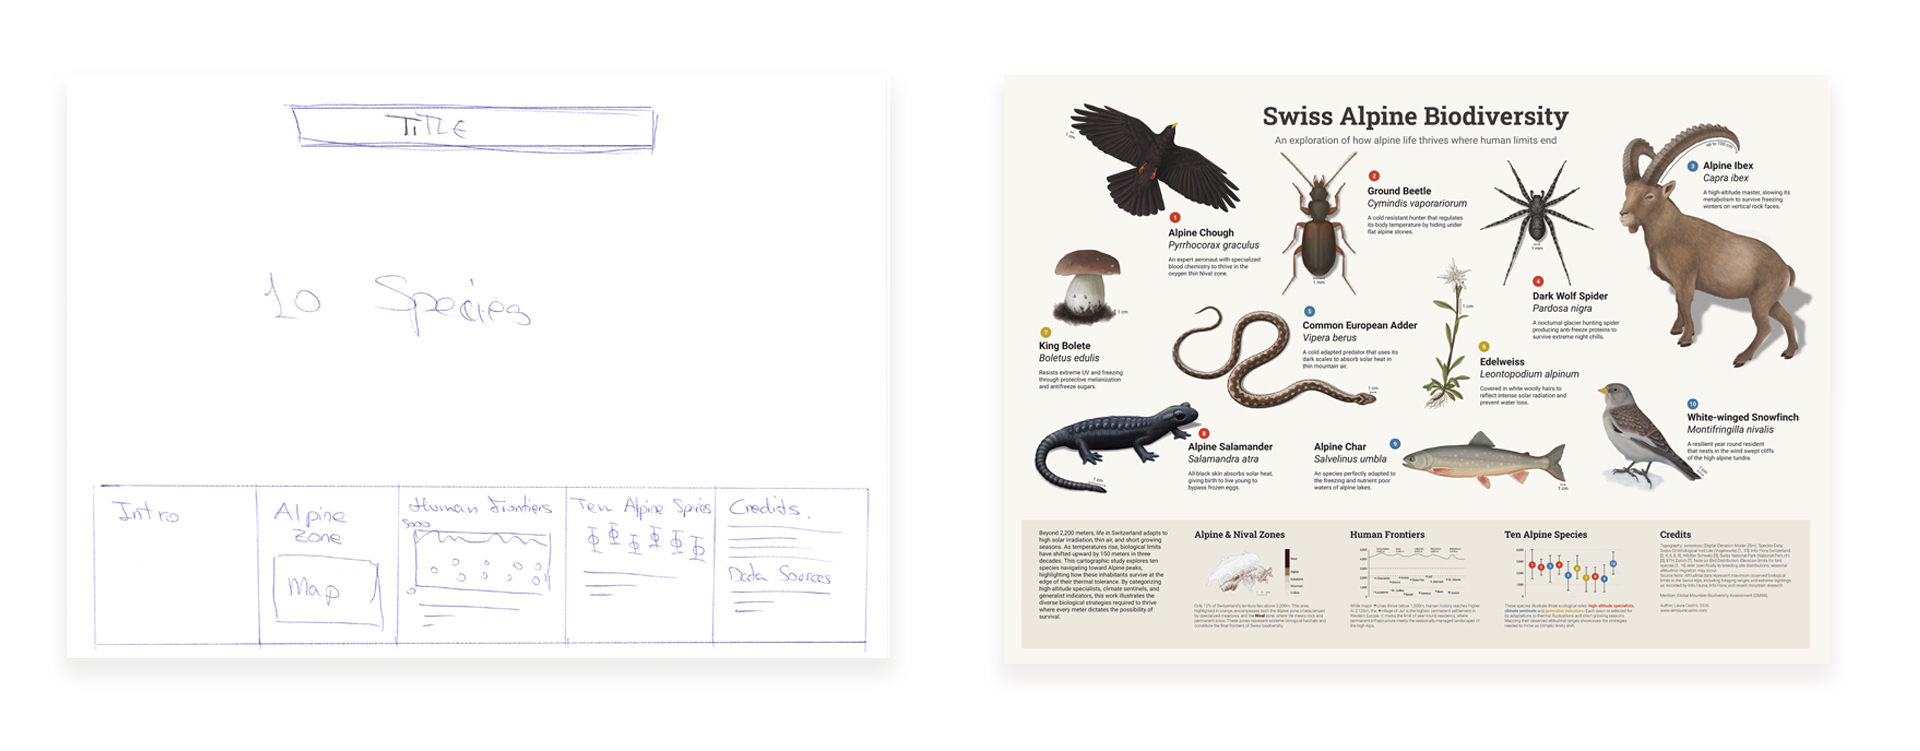
Development & Technical Execution: With the layout, texts, and illustrations fully defined, I built the interactive web experience. I utilized Claude Code as an engineering assistant to help translate my design specifications, responsive layouts, and interactive graphics into clean code.
Scientific Review: To ensure accuracy, I collaborated with the Global Mountain Biodiversity Assessment (GMBA), who reviewed the final infographic content, species descriptions, and ecological narratives.
Deliverables
The final outcome of this project is a responsive interactive infographic designed with a clear storytelling flow to explore species altitudinal distribution across the Swiss Alps and a set of ten hand-drawn digital biological illustrations created specifically to bring rich visual texture and scientific precision to the digital interface.