Context
Novartis ERC (Ethics, Risk & Compliance) is a crucial division within Novartis responsible for overseeing and managing aspects related to ethics, risk, and regulatory compliance. This division focuses on promoting ethical values, providing training in business conduct, and offering guidance to resolve ethical dilemmas. Additionally, it is responsible for identifying and managing potential risks, developing contingency plans, and continuously monitoring to minimize negative impacts.
Objective
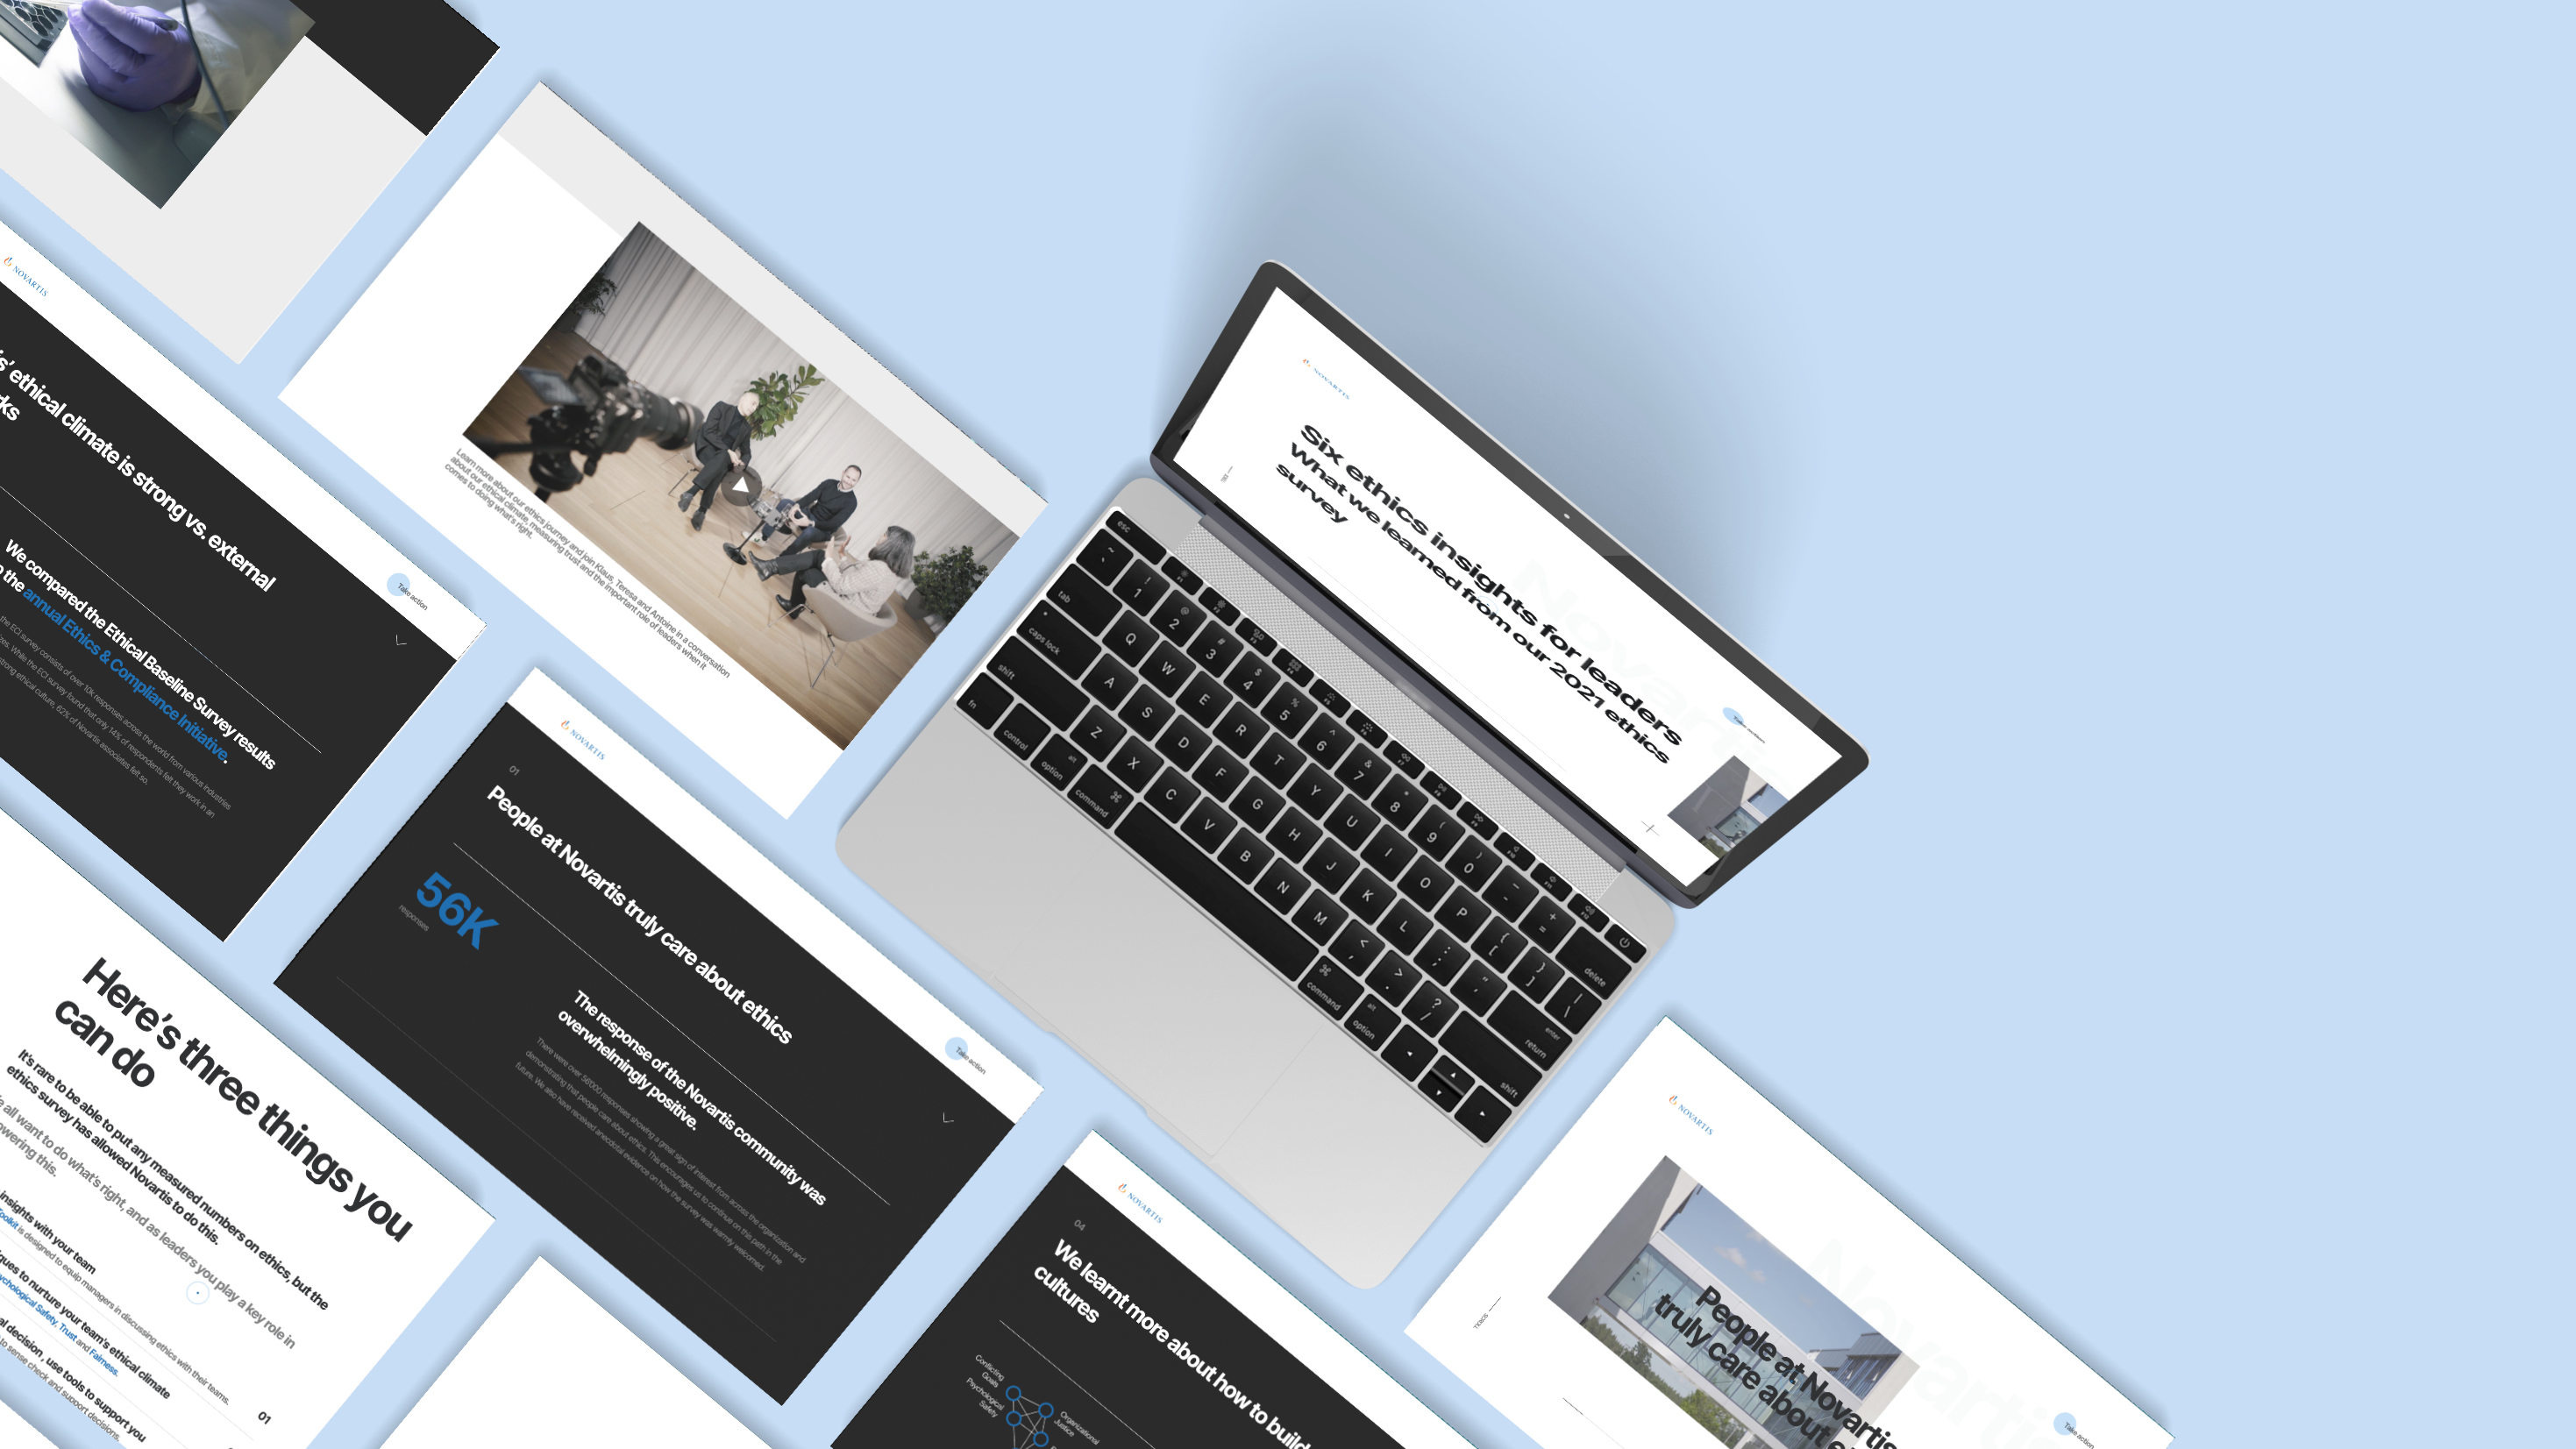
Ethical decision-making is often a very abstract construct, especially in large multicultural organizations like Novartis. According to scientific research, ethical decisions are influenced by several factors, such as psychological safety, fairness, organizational justice, and conflicting goals. Hence, understanding and shaping ethical decision-making in organizations requires a thorough examination of the decision-making processes and tailoring measures to the specific needs of the organization. The objective of this interactive infographic is to help leaders in ethical decision-making through insightful data and analysis.
My Role
As a member of the team, I was tasked with designing and implementing an interactive infographic. My role centered on creating engaging and user-friendly interactive elements that enhanced the infographic's usability. I developed visually appealing graphics that effectively communicated the survey findings. Throughout the project, I maintained close collaboration between the Affective Advisory and Novartis teams to ensure that the infographic adhered to ethical guidelines and communication strategies.
Deliverables
The project’s outcome was the design, implementation, and analysis of a comprehensive survey on ethical decision-making. It further included several trainings, publications, and resources on ethical decision-making created by Affective in collaboration with Novartis’ in-house team.
- Bias Repository: A tool for employees to evaluate ethical decision-making and access support resources.
- Interactive Management Dashboard: Developed to be automatically informed and updated by the yearly survey results.
- Digital Infographic: Sent to over 20,000 leaders within the company as part of internal communication efforts.


